Press Release
Published 10/2013
NOJA Power PC-based software automates power quality analysis
New Power Quality Software enables utilities to automatically identify harmonics, monitor interruptions and measure sags & swells in electricity supplies in order to meet power quality requirements and protect line assets.

Electrical switchgear engineers NOJA Power today announces the release of its Power Quality Software (PQS). PQS is a PC-based software application that automates the analysis of data captured by NOJA Power’s OSM range Automatic Circuit Reclosers (ACR) and associated RC-10 controllers.
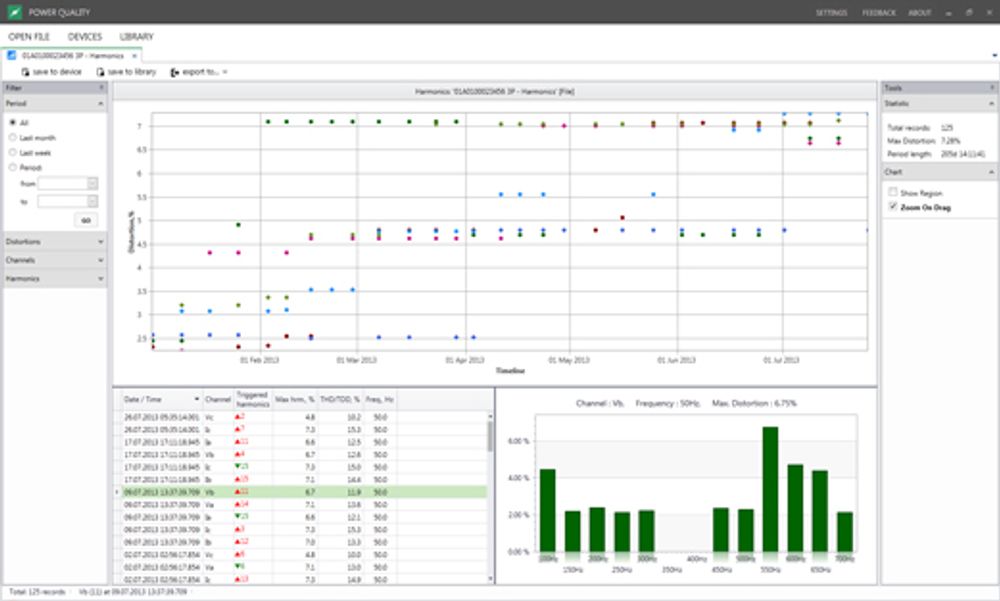
The PQS automates the analysis of factors that affect the quality of the power supply such as harmonics, interruptions and under- or over-voltages (“sags & swells”). This analysis is important because it allows utilities to address the cause of these factors before they degrade line assets or trigger penalties from regulatory bodies.
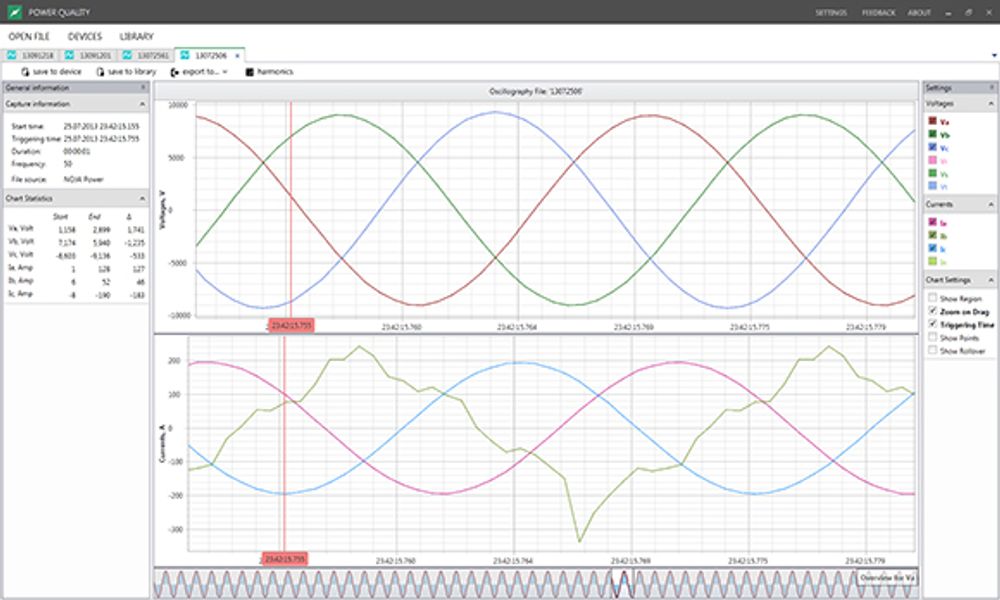
The PQS’s functionality includes full oscillography (waveform tracing), analysis down to the 15th harmonic and calculation of industry-standard indices such as Momentary Average Interruption Frequency Index (MAIFI) and System Average Interruption Frequency Index (SAIFI).
Industrial and domestic users are increasingly compromising power supply quality. The University of Wollongong’s long-term power quality monitoring project, for example, has found that the incidence of harmonics in the Australian medium-voltage (MV) distribution grid almost doubled over a three-year period in the first decade of this century and the trend is likely to continue[1].
Sources of harmonics include microgeneration systems such as domestic roof-mounted photovoltaic (PV) panels that introduce disturbances into the distribution network as an artefact of the inversion that converts the DC voltage of the panel into line AC voltage. Second, semiconductor-based consumer products increasingly employ switch mode power supplies that generate non-linear loads and can ‘reflect’ unused energy back into the distribution grid in the form of harmonics. And industrial users such as arc furnaces or electroplating processes can also introduce unwanted harmonics into the network.
Utilities are required to meet standards for power quality or face penalties. For example, AS/NZS 61000.3.6[2]––which advises on emission limits for non-linear loads in MV and high-voltage systems––states that the total harmonic distortion (THD) for MV grids should be no greater than 2 percent at the “point of common connection”. Not only should THD (voltage) and total demand distortion (TDD – current) be kept below mandated thresholds, but deviations from the nominal voltage (sags & swells) and interruptions (caused by factors such as tree branches and animals shorting feeders) must also be monitored and minimized.
In addition, harmonics overload the distribution grid generating heat that eventually damages equipment and insulation. Such damage raises utilities’ maintenance costs and increases the risk of outages. Consumers’ equipment, particularly that using large electric motors, can also be affected.
NOJA Power’s ACRs and RC-10 controllers are able to record power supply data for customer-determined durations, sections of feeder and user base. Previously this raw data was useful for indicating system overloads, but couldn’t be used for more detailed analysis. Now, once the data collected from the RC-10 controller is supplied to the PQS software, the results are rapidly automatically analysed, waveforms displayed and harmonics identified for all three phases, allowing the user to quickly react to problems.

“Power quality measurement is becoming ever more important as consumers and industry connect appliances and equipment to the distribution grid that could potentially introduce unwanted harmonics,” says Ryan Cameron, Sales Engineer for Australia and Pacific Region with NOJA Power. “As part of our ongoing product development and in response to customer demand we looked for a way to use the data-collection capability of the ACR and controller such that the customer could quickly extract the key information and trends from the raw data. The result was the PQS – analytical software that runs on a PC or tablet computer, is easy to use and automates the production of oscillography and harmonic information as well as key industry performance indices.
“Even better, customers can use the information obtained from the PQS to program the ACR to protect infrastructure in the event of a harmonic exceeding a predetermined threshold,” adds Cameron.
“The PQS isn’t just useful for utilities,” comments Martin Van Der Linde, Testing Engineer with NOJA Power and the person responsible for testing the application, “it’s also a valuable tool for ACR customers such as mining companies that want to check that internal operations are not injecting harmonics back into the grid from their spur nor risking damage through harmonics to their own electrical assets.”
The PQS is available to all NOJA Power OSM range ACR customers, free of charge.
References
1. “The Australian long term power quality monitoring project”, University of Wollongong, 2008.
2. AS/NZS 61000.3.6 "Limits - Assessment of emission limits for distorting loads in MV and HV power systems".
Want to stay up to date with Electrical Distribution Technology?
Join our list for a free weekly technical bulletin, as we share our Global Electrical Engineering experience directly to your inbox.
Subscribe →